Ecommerce Returns by The Numbers In 2021
Ecommerce returns dominated the headlines in 2021 and we’ve learned more in the last 18 months than we have in the entire existence of ecommerce.
Why? It wasn’t really a choice.
The pandemic forced ecommerce’s hand and led to explosive growth. The U.S. saw a 27% increase in ecommerce sales in 2020, a 15% increase than in the previous year.
This boom has put all eyes on ecommerce, a completely new market for retailers to navigate.
And returns seem to be a big part of this market.
In fact, approximately 20-30% of all items bought online get returned.
If this last year taught us anything, it’s that having a handle on returns is crucial to your survival and growth as an ecommerce retailer.
This guide breaks down everything 2021 taught us about returns and how those lessons can be applied to your business in 2022.
Table of Contents
The Returns Industry is Massive
In 2020, $102 billion was spent on returned sales in the U.S. alone.
While we’re still waiting for the total cost of returns in 2021, Optoro estimates that $66.7 billion worth of goods will be returned just between Thanksgiving and the end of January 2022.
B-Stock seconds this by stating 13% of all holiday purchases will get returned.
This makes one thing clear: No matter what you do, returns aren’t going anywhere.
Yet, they’re notoriously known for being a bad experience for both shoppers and retailers.
Something has to change about the way returns are managed. Too much money is spent for them to only exist as a bad experience for everyone.
The conversation is no longer about eliminating returns. It’s about understanding how they interact in the market to turn it into an opportunity rather than an obstacle.
Breaking Down the Costs of Returns
Here’s a breakdown of what 2021 taught us about all of the costs associated with managing returns:
Cost Per Return
The cost per return varies greatly depending on the industry and what factors you consider.
In Optoro’s 2016 study, they found the average return represents 30% of the purchase price. Since the average margin for an online order is 10%, that means a retailer would need to sell 3x as many units just to recover the cost of a single return.
Later on, in 2021, Optoro reported returning a $50 item is expected to cost an average of $33 – up 59% from 2020.
The exact price is tough to nail down but the theme is clear – returns are getting more expensive.
Profits are eaten by processing returns, facilitating refunds, checking and restocking the returned product, labor costs, and more. Not to mention, most returned items don’t actually make it back to the shelves. If an item is out of season, used, or damaged, it might not be possible to restock, eating into margins even further.
So, what specifically goes into the cost of each return?
The average return cost consists primarily of the
- Labor cost
- Shipping cost
- Customer acquisition cost
- Cost of the returned item
The average labor cost is about $15/hour. Manually processing a return is a huge time-suck. Some retailers can manually process returns in an hour or two, some take weeks.
Why so long?
Once an item gets back to the retailer, a warehouse team member has to receive the product and record its arrival. From there, a customer service rep must confirm the item is accounted for and finds the order online to initiate the return. Meanwhile. The warehouse team has to get the product to its next location (restock, secondary market, or toss it).
According to our internal data of over a million returns, the average shipping and label costs are between $7-$9 per return.
Let’s say the average return takes an hour (conservatively) with labor costs are $15. Tack on the shipping cost and we’re at roughly $22-$24. That means before CAC or the cost of the returned, a return already costs close to $25.
CAC costs vary by industry, with arts and entertainment as low as $21 and food and beverage as high as $462 – for simplicity’s sake, let’s say CAC is $50. So we’re sitting at $65 for the return so far.
Now, if the cost of the item is about $35, then a single return costs $100. So if you’re selling 1,000 items a month, returns cost you roughly $100,000 per month.
Pro tip: Returns Management Platforms can automate most of the returns workflow and get the time to process a return down to a few minutes. Furthermore, returns management platforms give visibility across teams and can integrate with your reverse logistic tools to help you get a grasp on returns and turn them into revenue.

Cost of Fraud
While retailers have adopted flexible return policies to please shoppers, they’ve inadvertently introduced a trojan horse – returns fraud.
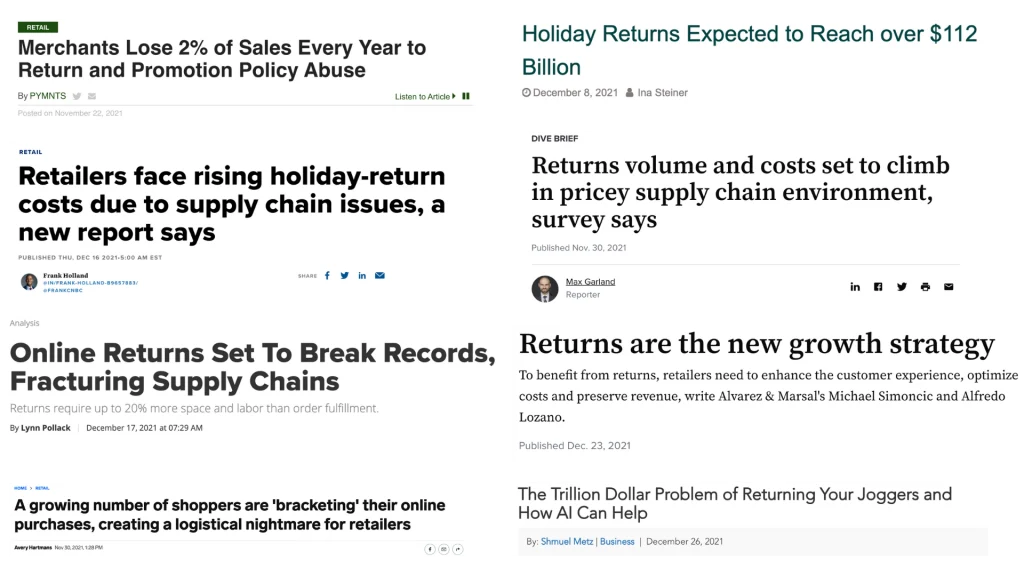
Retailers are getting hit with $90 billion of bogus returns and promo abuse yearly in the U.S. This amounts to a roughly 2% loss of yearly sales.
Retailers are struggling to find a solution to customers abusing their policies because fraud is hard to track and manage.
According to a study done by Forter and PYMNTS, 39% of retailers rely on manual review to find repeat offenders.
The study found that over half (53%) of merchants say the lack of an ability to act at scale is a significant challenge in preventing fraud.
Some of the other top reasons for this obstacle are:
- No ability to identify repeat abusers
- Lack of a clear owner of responsibility
- No ability to quantify the magnitude of abuse
Having a returns management system that solves for these challenges can prevent retailers from having such a high rate of fraudulent returns.
Pro tip: Requiring photo uploads for returns can help prevent fraud. Similarly, tools like Signifyd can help with automating fraud prevention and save your bottom line.
Supply Chain Costs
With $550 billion worth of ecommerce goods returned each year globally, supply chains costs are estimated at $50 billion.
Not to mention, roughly 37% of retailers said returns have increased their operational costs and 25% of retailers have had to invest in additional warehouse space for returns.
Returns require products to move back up the supply chain.
Like we mentioned earlier, there are a lot of moving parts:
- The customer needs to send the product back to the proper postal service.
- The warehouse needs to approve receiving the returned product.
- The operations team needs to analyze the product and qualify it for the return.
- The customer success team needs to be alerted of any problems with the product.
- The customer will want to be kept up to date throughout the entire process.
Now imagine having to do this for every, single, return request.
Without a proper system of reverse logistics in place, moving returned products back up the supply chain can become costly.
Pro Tip: Having a returns management system that is visible to all teams gives everyone easy access to the notes on each RMA, minimizing loss of information between steps.
Shipping Costs
Although shipping can be costly, 49% of retailers still offer free return shipping. Why?
Well, companies like Zappos leverage their free shipping and returns policy with fast marketing to establish a loyal customer base.
In fact, this has worked so well that it has changed consumer behavior at scale. 50% of shoppers say free return shipping is most important to them when returning an item bought online.
Shopper expectations have also changed to expect speed, making reverse supply chains and logistics more challenging.
According to Shippo’s State of Shipping Report 2021, over 50% of retailers identified the cost of shipping as the biggest challenge to their business – carrier reliability came in as the second biggest challenge at 13%.
This makes sense. Just the cost of generating a shipping label alone averages at $8.12 (based on ReturnLogic internal data of 150 Shopify retailers).
But what can be done about it?
Well, many merchants have tried mitigating these top 2 challenges by turning to consolidators or fulfillment partners.
They are known to have lower shipping costs, although rates may vary. Plus, this gives retailers room to work with multiple carriers.
Having multiple carriers helps reduce the number of problems that occur with customers due to unreliable shipping.
In fact, 75% of merchants worked with 2 or more shipping carriers in 2021 – up roughly 18% from 2020.
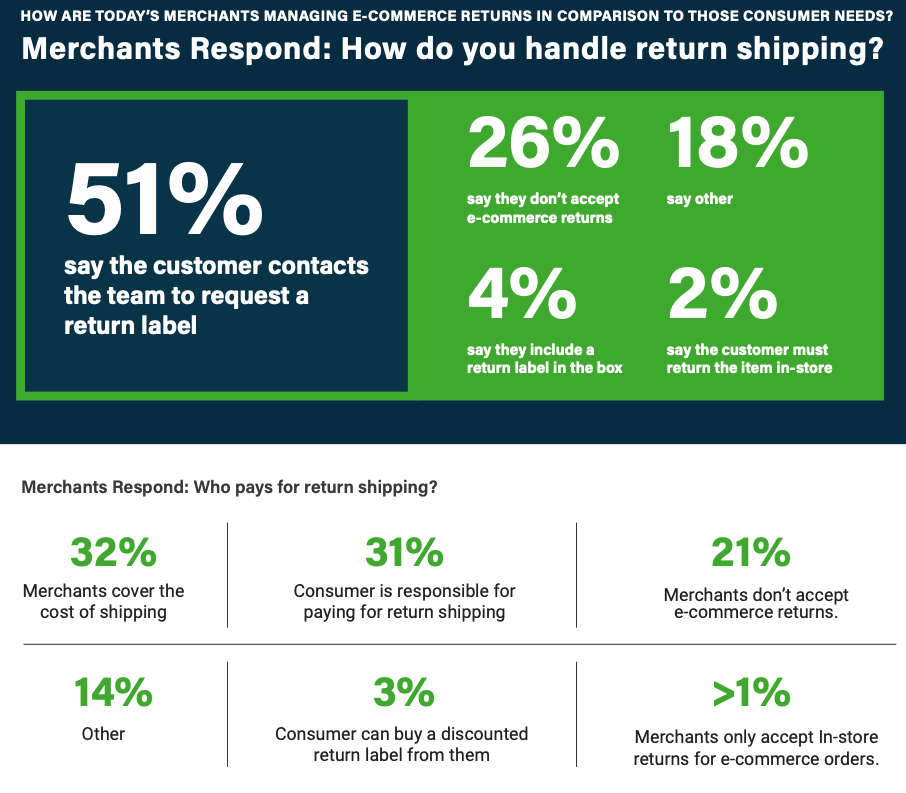
Image source: Shippo State of Shipping Report 2021
At the end of the day, every return policy is different and really depends on the preferences of the retailer.
However, it’s important to understand where the biggest costs in shipping returns lie so retailers can create a policy that best benefits them and their customers.
Pro Tip: Automatically generated shipping labels at the time of returns will keep customers happy with the speedy process.
Cost of Time Delays
Prior to the pandemic, it took about 4.5 days on average to register a return. Now? Roughly 8.2 days.
For ReturnLogic retailers, the average time between RMA stages (return initiated to completed) was roughly 1 week – with June and July reaching as high as 10-11 days.
The longer a shopper has to wait for their refund or return, the less likely they are to buy from you again.
The second a customer starts a return, the clock is ticking on whether they churn.
Retailers that find a way to reduce time on processing returns will surely stand out in 2022.
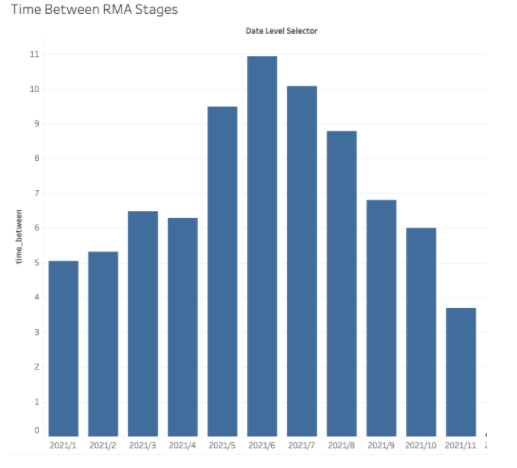
Image Source: ReturnLogic internal data on 150 Shopify retailers
Cost on Customer Lifetime Value
You can add up your shipping costs, labor costs, CAC, and cost per return, etc., but there are additional costs to returns that are harder to quantify, so they’re often overlooked.
The most overlooked cost is the impact returns have on future customer lifetime value (CLV).
Traditionally, customer lifetime value has been measured as the total amount a customer spends with a brand over their lifetime as a customer.
Ex: If a shopper spends $150 a year and shops with you for 4 years, their CLV is $600. However, every return negatively impacts CLV.
A customer may have been a loyal shopper for a while and might have a high CLV, but what if they had a bad returns experience from you and churned?
The cost of that bad returns experience goes beyond just the cost of the return.
The future customer lifetime value of that shopper is also lost.
Not to mention, without knowing who has churned, marketing dollars may be wasted on trying to get lost customers to buy more.
Quantifying how big an impact returns have on CLV isn’t straightforward or easy to measure, but understanding the relationship returns have on CLV can help retailers stay cognizant of their post-purchase experience and how important it is.
So, there are a lot of costs, obstacles and challenges associated with managing returns.
It’s no wonder why retailers have traditionally seen returns as the bane of their business.
However, with this understanding of all the costs associated with returns, returns management can actually be used as a marketing strategy that gives the competitive advantage needed to fuel growth.
Returns Are A Sales and Marketing Channel
While returns, in general, can be expensive, they clearly play a big part in the ecommerce customer journey.
Turning it into a positive experience can prevent the customer from churning due to a poor post-purchase experience, which will help promote future customer lifetime value.
Plus, with over 91% of customers considering a brand’s return policy as an important part of the buying decision, returns also play a big role in the pre-purchase experience.
Online shopping gives returns a new sense of importance to consumers, which should give it a new sense of importance to retailers.
Knowing what we do now about returns shows that optimized returns management has the potential to be the best competitive advantage of 2022.
Providing Return Type Options
How do you turn the returns experience into a competitive advantage?
Today’s market is all about customizable solutions.
Customers want options when it comes to solving their returns problems. When given them, it can significantly impact their returns behavior.
Ecommerce stores that don’t offer exchanges see a refund rate of 80% on average. When exchanges are offered, refund rates drop to 60%.
However, refund rates drop to roughly 50% if warranties are also offered as a return option.

Image Source: ReturnLogic analysis of over a million returns
Why do refund rates matter so much?
Refunds are ultimately money lost, whereas exchanges, store credit, and warranty requests can save the sale. Exchanges allow for an upsell opportunity and improve retention – same with warranty requests.
For instance, if you’re processing 10,000 returns per year, a 10% drop in your refund rate, on average, equates to roughly $50,000.
Segment and Personalize
In addition to offering different return types, retailers should customize their marketing strategies to each customer.
Life would be a lot easier if treating every customer the same was profitable… but it’s not.
Deepening the relationship with customers requires making the brand seem like a solution personally built for each target customer’s individual problems.
This is what makes personalization and segmentation so profitable.
Retailers have only recently begun to create different workflows for different shoppers.
Now, the returns workflow for a first-time shopper can look drastically different from a workflow for high-value or VIP customers.
For example, a VIP shopper might get an extended return window, free shipping, or product recommendations when they initiate a return whereas a first-time buyer would not.
Oddly enough, sometimes your most profitable customers return the most items so giving them a unique post-purchase experience helps to keep them happy (and buying).
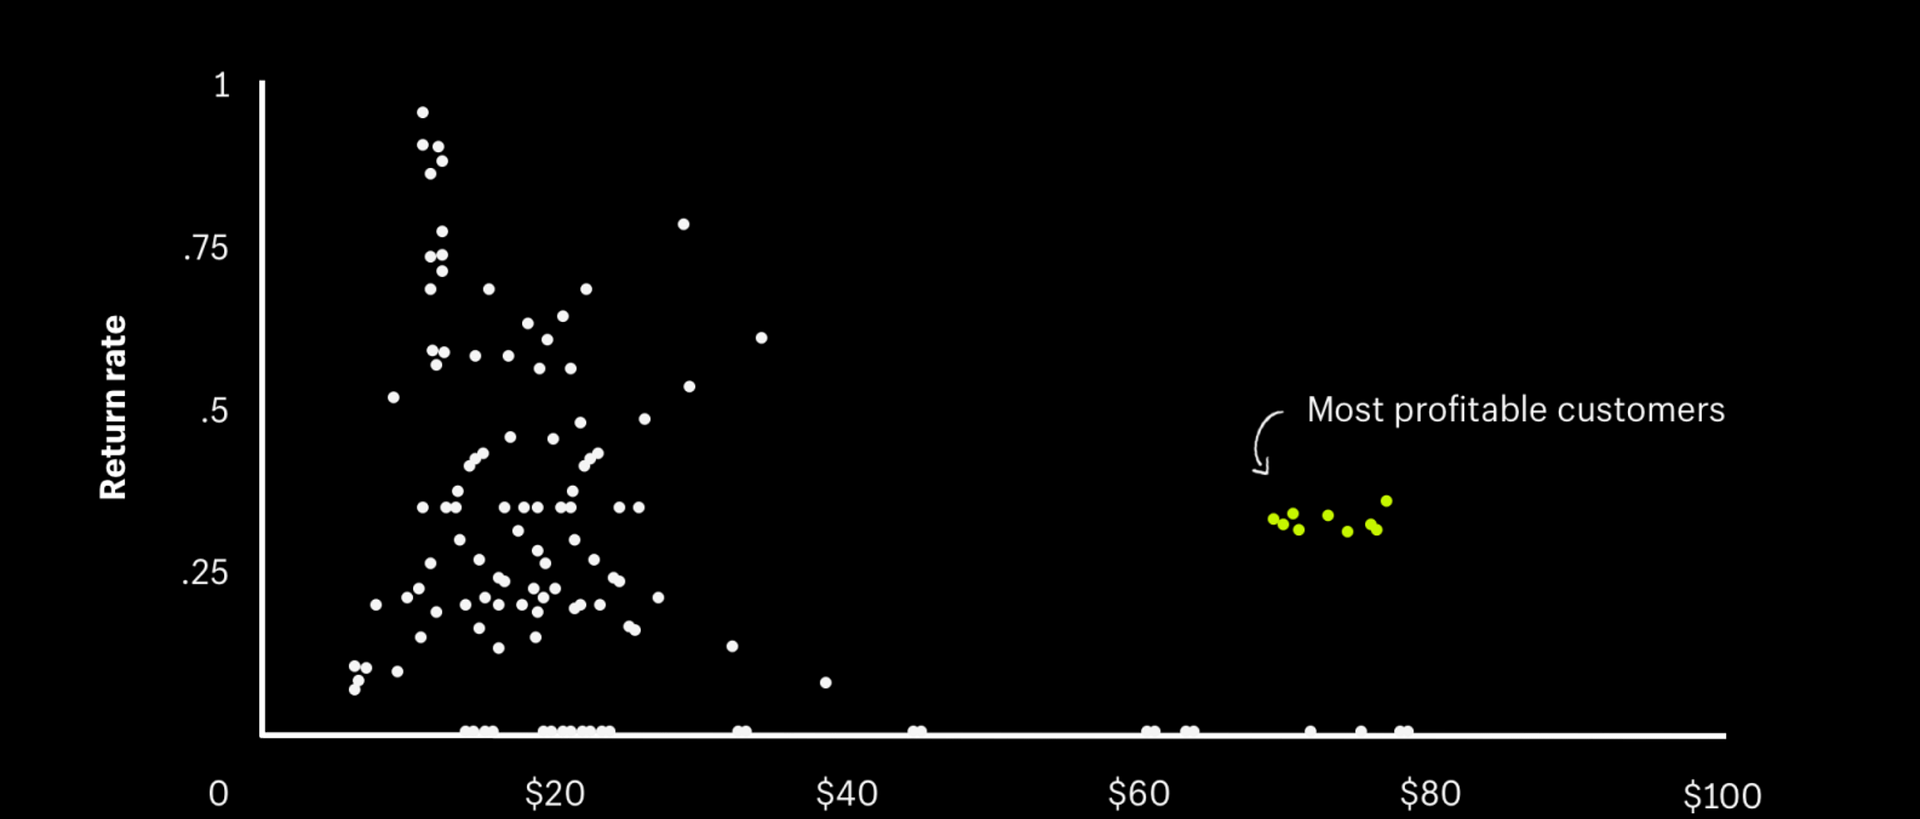
Image Source: ReturnLogic returns optimization
Improve Conversions by Having a Crystal-Clear Return Policy
As mentioned earlier, return policies influence buyer behavior, so another competitive advantage retailers can capitalize on is making sure their return policy is 100% transparent.
In their May 2021 study, Digital Commerce 360 and Bizrate Insights found that 23% of online shoppers found return policies to be restrictive, and 18% weren’t even able to find the retailer’s return policies. 16% said return policies were hard to understand.
So what should specifically be included in your return policy to help customers convert?
- Return Window – can a customer return their purchase? If so, how long do they have to return it?
- Where to start – make it clear exactly how to start a return. Is it online through your returns portal? Do they have to call or email you? Can they drop it off at your store?
- Timing – how long do returns normally take to process? Make sure to communicate and keep the customer up to date.
- Cost – be transparent if there are any additional costs. If you sneak in hidden costs or shipping fees, it could deter a person from buying again. In contrast, if you have free return shipping, that’s a big competitive advantage you can highlight to help convert shoppers as well.
- Specify items that aren’t returnable – make sure shoppers know if items have to be in a certain condition or if there are certain types of items that don’t qualify for returns.
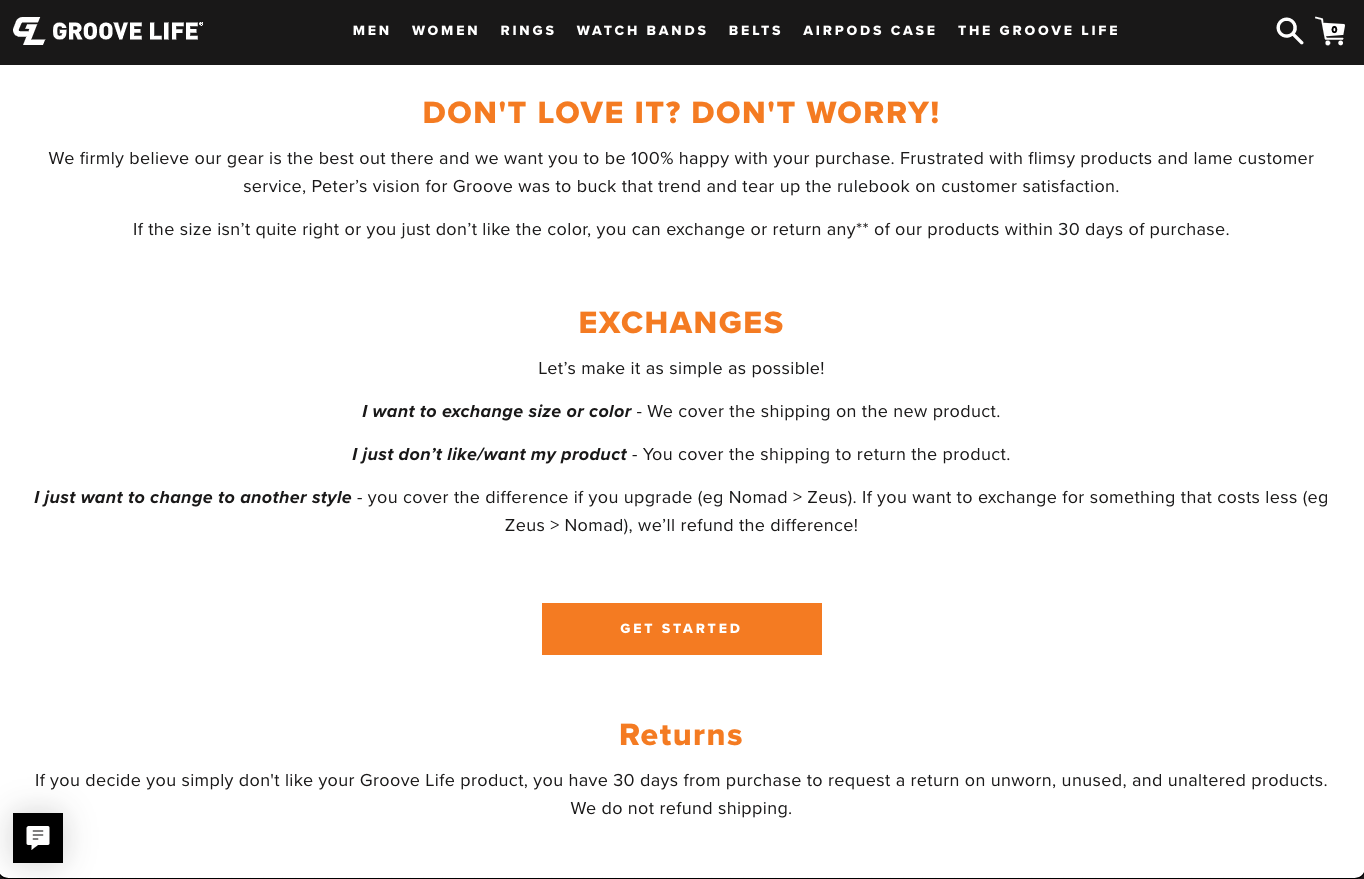
Image Source: Groove Life return policy
Pro tip: Adding your return policy to product description pages boosts conversion rates.
According to Narvar’s Return Policy Benchmark Report, 39% of retailers offer a 30-day return policy. However, this 30-day arbitrary window isn’t always the best idea. In fact, some of the biggest retailers out there don’t have a cap on their return window (Nordstroms, Sakes, American Eagle, Famous Footwear, etc.)
Why might that be?
The longer a customer keeps an item, the more likely they are to keep it. The longer they keep it, the more likely they are to grow to like the product. The shopper is also more likely to forget about it.
Longer return windows also allow returns to get spaced out instead of being concentrated and keeping your customer support bogged down. If you only allow 30-day return windows around the holidays, it’s likely your team will get overwhelmed, and orders will take longer to fulfill leading to churn.
Since 67% of shoppers check the returns page before making a purchase, making your return policy clear can be the difference between a website visitor and a lifelong customer.
Communicate Often and Set Expectations
In their study on shopper returns behavior, Digital Commerce 360 and Bizrate found that 29% of respondents had difficulty reaching a customer service representative, and 21% were disappointed with a lack of return status communication.
Integrating a live chat option into your returns workflow can help customers get immediate answers and get the support they need if your returns workflow doesn’t solve their problem.
In addition, retailers should make sure automated emails are going out to let the customer know you’ve received their return request, you’ve gotten the product back, the returned item is out for delivery, etc. – always over-communicate. You could even text the customer to give them updates as well.
Retailers can also take a proactive approach to returns so they have fewer returns to deal with in general.
Determine If Free Return Shipping or No-Return Refunds Makes Sense for You
We mentioned free return shipping earlier, however, free return shipping doesn’t make sense for every business. So how do you know if you should offer it? Well, we’ve created a step-by-step video below to help you answer that question. But let’s take a look at what shoppers had to say.
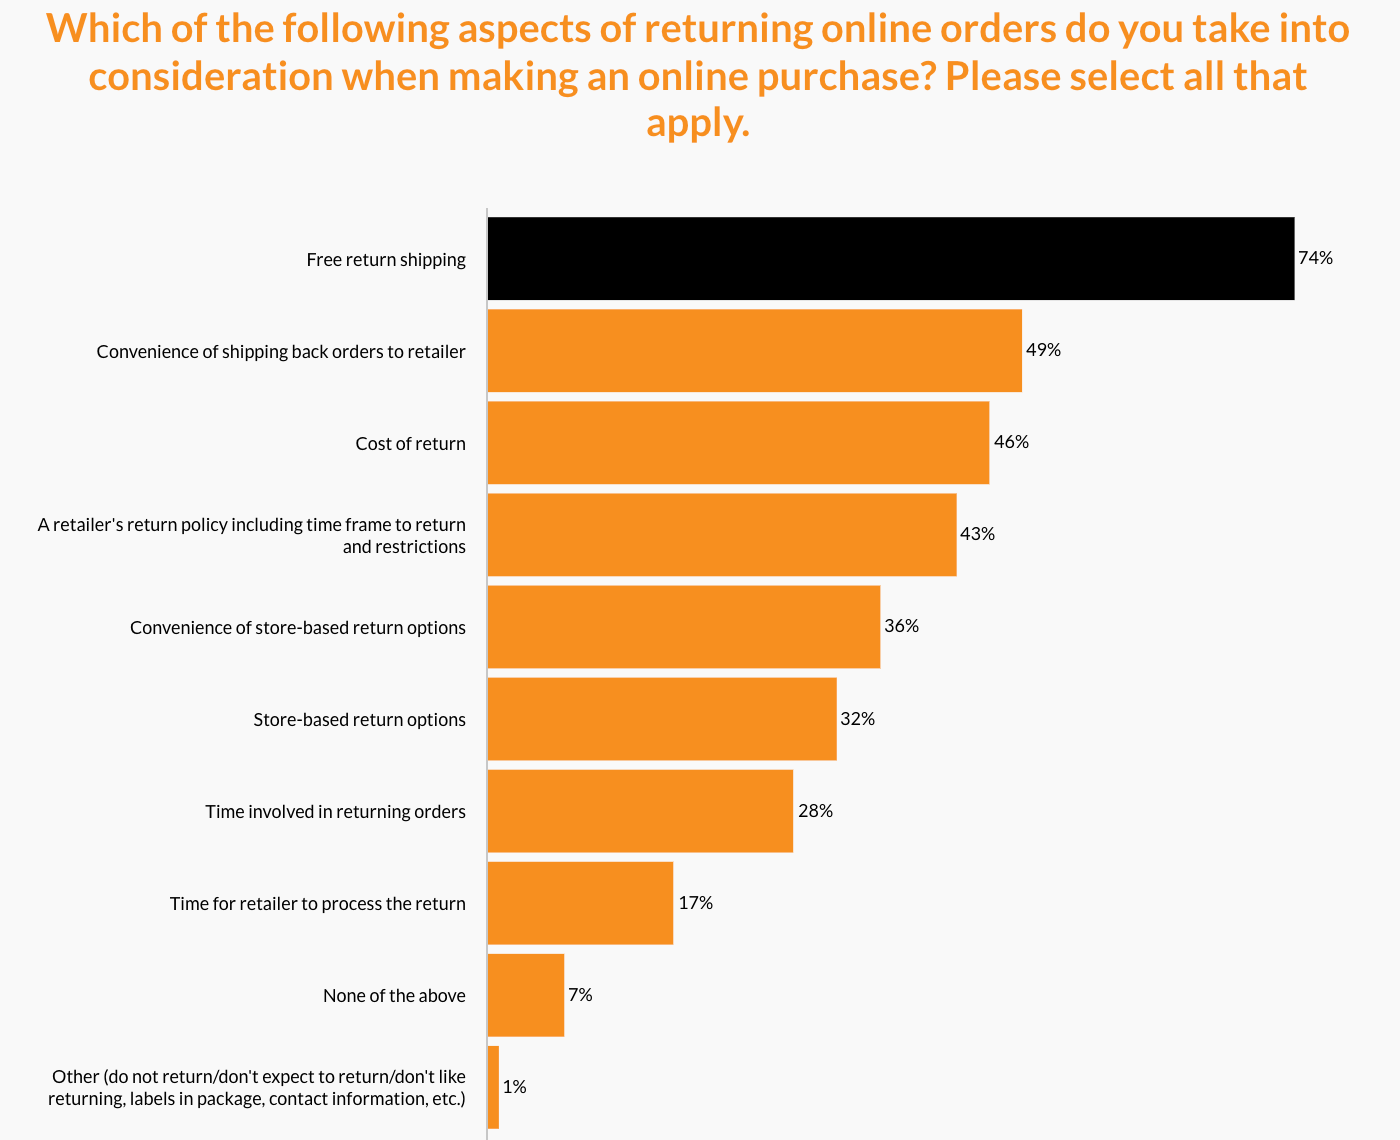
Image Source: Bizrate and PYMNTS 2021 study
Free shipping is in high demand, but it can be costly. Similarly, companies like Amazon, Walmart, and Target are even adopting ‘no-return refunds’, where they tell shoppers to keep the item and they’ll just issue a refund, however, we don’t recommend that practice.
Why? Because if you add it up, the cost of a refund gets pricey, quick.
You have the cost of the returned item, the labor cost of processing the return, shipping costs, and customer acquisition costs. Not to mention that customers could just never shop from you again anyway, so the cost of no-return refunds gets unsustainable quickly for most businesses and verticals.
Instead of giving every customer free return shipping or no-return refunds, retailers could use either option as a perk for loyal customers.
So how do you get to a place where you can segment customers? By checking our returns data.
Use Returns Data to Improve Your Product Description Pages and Lower Your Return Rate
Knowing what customers don’t like about your products is equally as important as knowing what they do. Once you know what customers like, you can double down on it. When you know what they don’t like, you can avoid it or change it.
For Ecru, the feedback in return reasons and comments tells them when a product may need adjustment, or if the product description may need to be updated on the website. Furthermore, returns data gives them insight into how to improve their marketing strategy.
So what adjustments can retailers actually make?
Here are some examples:
- Add sizing guides to product description pages.
- Include the return policy on the product description page.
- Invest in better photography or AR/VR technology for sizing issues – you want to ‘show’ the fit to the best of your ability.
- Incorporate keywords from your marketing strategy into your product description pages.
- Include shipping times or expected delivery dates.
- Include reviews on product description pages.
All of these adjustments to your product description page help with conversions but they also help with differentiating your brand.
Retailers Want Customization & Configurability to Differentiate Their Brand
Since returns are another touchpoint with customers – retailers are realizing the value of having a consistent branding experience. A returns workflow should feel like an extension of a retailer’s website.
However, every return policy is different. Meaning, retailers need customization and configurability to create the most profitable return policy. We conducted a survey of over 150 Shopify store owners and found that the number one thing they needed was more customization and configurability.
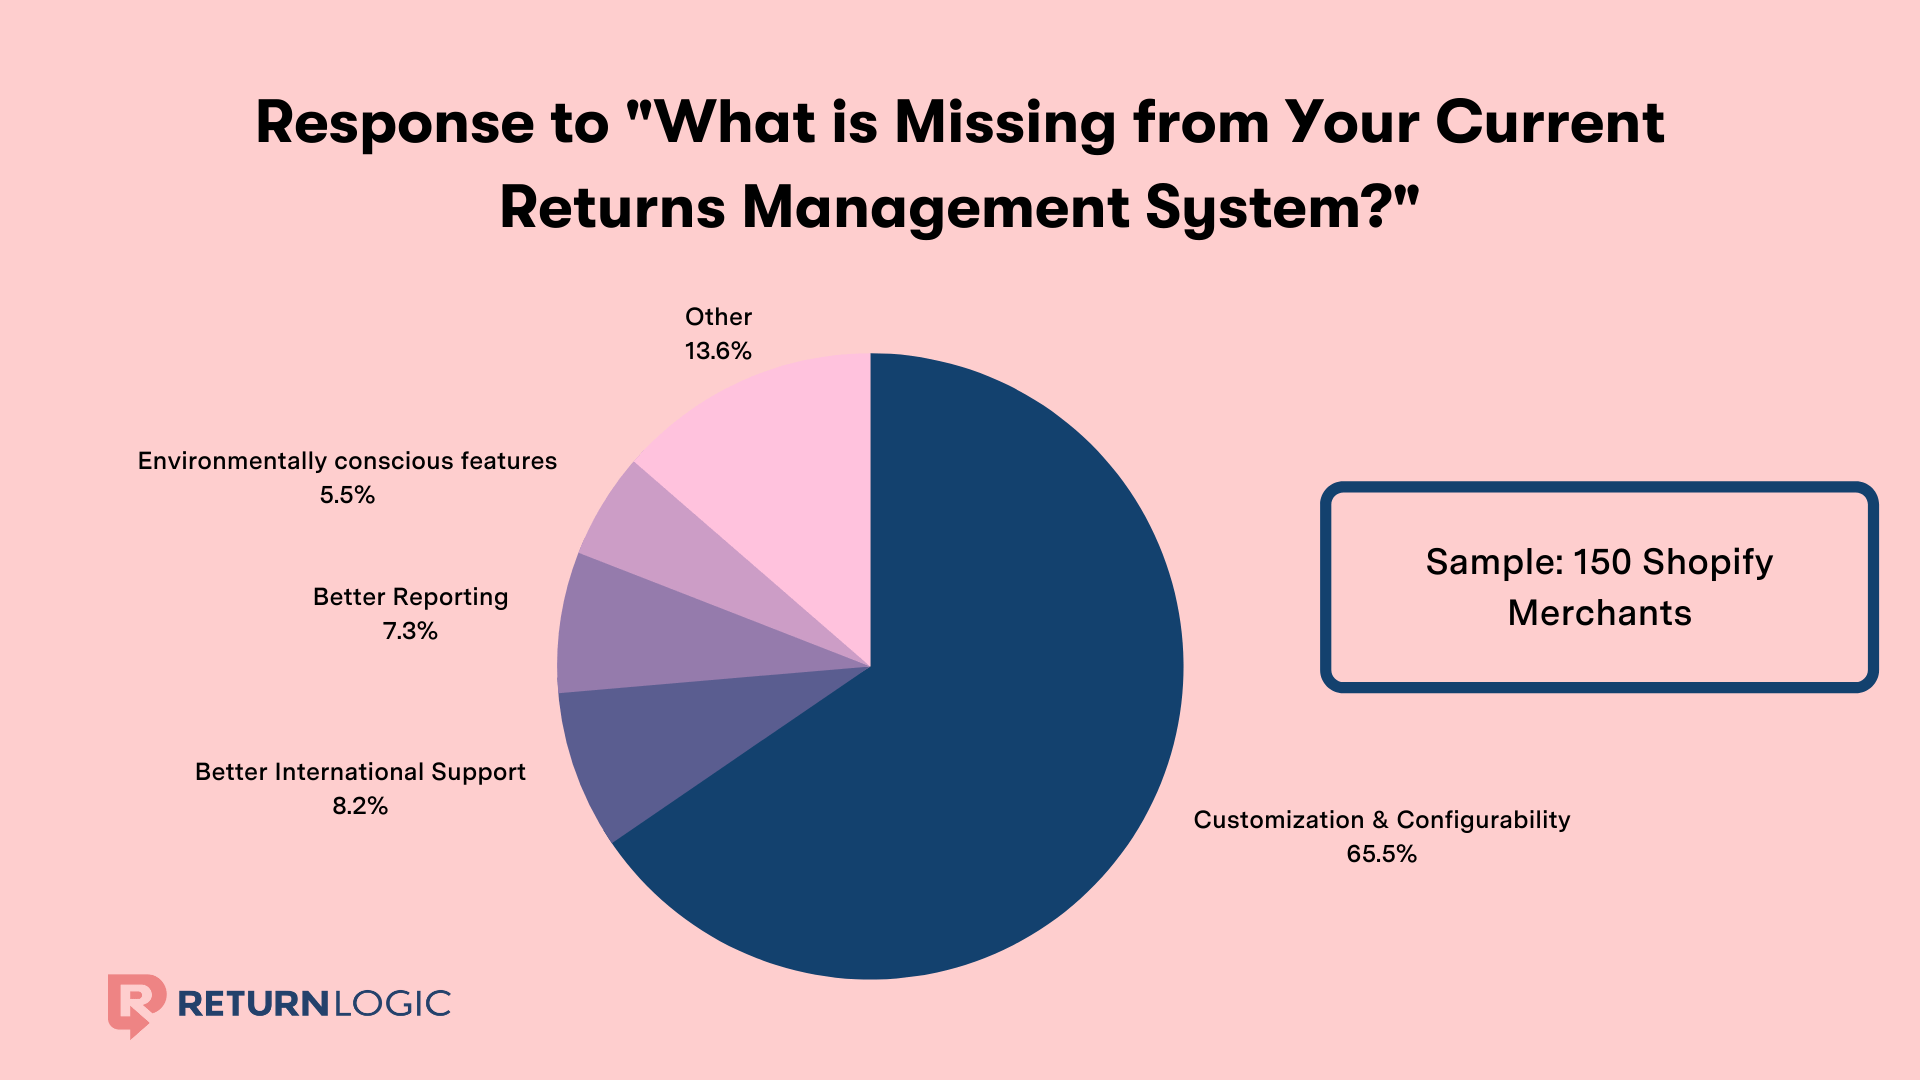
Image Source: ReturnLogic survey of 150 Shopify retailers
Configurability allows retailers to enforce their different return policies.
Every Vertical (and retailer) Is Different
After processing over a million returns last year, our team found the most common return reasons for fashion product categories are size, fit, style, etc. – approximately 75% of returns.
So, it makes sense fashion companies would focus on exchanges.
In contrast, retailers in a vertical such as electronics tend to focus on store credit and warranty requests since the most common return reason tends to be “damaged” or “faulty” – close to 50% according to our internal data.

Image Source: ReturnLogic analysis of 500,000 warranty requests
So, retailers in fashion may set up their workflow to incentivize exchanges. But since electronics don’t tend to do exchanges, they may set up their workflow to incentivize warranty requests or workflows that are different depending on return reason.
This poses a challenging dilemma for returns management and reverse logistics platforms. How can we provide enough flexibility and configurability to support any return policy, on any platform, for any retailer, anywhere in the world?
The most obvious answer is by recognizing that reverse supply chains and returns management is an ecosystem full of different nodes that need connecting.
Returns Are an Ecosystem
In the past, reverse logistics has required various tools that all store data separately that could not communicate with each other – like independent nodes. Now, via APIs and integrations, reverse logistics and returns data can flow between various platforms and connect all those nodes – like an ecosystem.
Retailers can now make ‘Returns Stacks’, or tech stacks that connect all the tools that store relevant returns data.
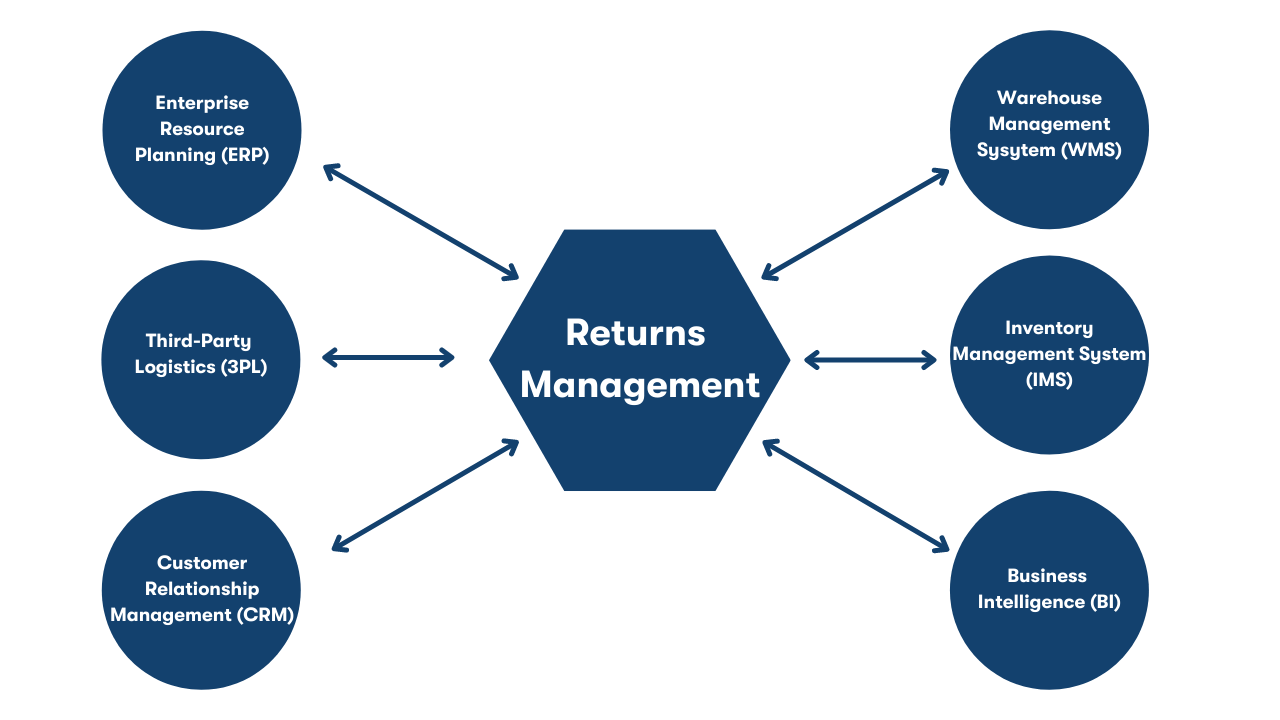
Why does connecting the different nodes in the reverse supply chain to returns management system matter? The goldmine of data you can get.
Once retailers can connect all the nodes in the reverse supply chain (returns management, WMS, IMS, ERP, CRM, 3PL, etc.) they can make informed choices on nearly every aspect of their operations, from design and financial planning to forecasting, manufacturing, and distribution.
Let’s take a look at what leveraging returns data could look like in real life.
Data is King
While conversion rates, ad spend, and sales are all indicators of what shoppers like, returns data tells you what customers don’t like, but that’s not all.
Returns data can tell you if you have a faulty manufacturer, if your shipping carrier is taking too long to get returned items back to shoppers, how much returns are truly impacting your bottom line, and much more.
But let’s check out a real-world example…
Let’s say an item has a high return rate – around 45%. After digging into the return reasons, the retailer figures out that the color isn’t meeting people’s expectations. Not ideal, but now the retailer has their root cause analysis figured out.
So, what can the retailer do from here?
- The retailer could start with lowering the ad spend on that item and reallocating those funds to items that are high-selling and that have low return rates.
- The retailer could connect with their manufacturer and see if there are any improvements that can be made to the material.
- The retailer could take some new product photos, invest in quality, and ultimately update their product description pages and ads.
- The retailer can then keep a close eye on returns for that item and check back to see how their improvements have impacted the return rate.
The only way to fix a problem is to know it exists – returns data can tell you that.
While this is just an example, retailers who adopt the ‘returns optimization’ framework can make this their reality.
Managing Returns Is a Journey
2021 uncovered a lot of insight about ecommerce returns.
However, all the stats become more insightful for retailers who understand where they fall on the Returns Hierarchy of Needs.
Based on Maslow’s Hierarchy of Needs for human motivation, the concept of the Returns Hierarchy of Needs states that achieving an optimized returns management system requires satisfying the basic needs of returns management first and working your way up.
This is the ‘Hierarchy of Needs’ journey every retailer takes before reaching “returns enlightenment”.
Retailers that know where they are in their returns enlightenment journey can focus on satisfying one returns management need at a time and ensure the solutions flow seamlessly into each other.
Steps of the Returns Hierarchy of Needs
Step 1: Introduce Automation
Customer service teams act as representatives for ecommerce retailers. It’s important for them to be prepared to make the best impression of the brand every time. At the end of the day, manually processing every return request is draining and risks having a service team that is short and impatient with customers.
Automating as much of the returns process as possible frees up the customer service team to deal with more complicated customer problems that require a more personalized response.
Plus, by auto-generating returns labels and automatically processing RMAs (return merchandise authorization), shoppers are given a ‘self-serve’ returns checkout experience.
With automation, retailers can auto-generate return labels, automatically process RMAs, and keep shoppers up-to-date on the entire process.
Step 2: Get Visibility
After automating communication with customers, it’s important for the company’s operations team to have access to all active RMAs so they know what to expect coming back up the supply chain.
Being able to have visibility into RMA processing across all teams allows the operations team to let customer success know what the status of the product being physically returned is.
This makes it easier to find any discrepancies between what the customer communicates and what the operations team receives.
Having full visibility also makes it easier to find where on the supply chain problems with products are occurring. By finding and fixing the root cause of product failures, retailers prevent themselves from an endless cycle of high returns.
Step 3: Optimize Returns
Once retailers can automate tasks and get visibility into what’s happening in the reverse supply chain, they can figure out which levers to pull to optimize their returns operations and ultimately create the most profitable return policy.
Satisfying the needs of the two previous steps puts systems in place to gather data on the company’s returns performance that’ll help show executive decision makers where the company’s weaknesses lie.
This pool of ever-growing data can be used for risk analysis and future predictions, to cut down on operational costs, and to assess the financial impact of the current return management system.
Armed with data, retailers can constantly improve and prevent returns from stunting their growth.
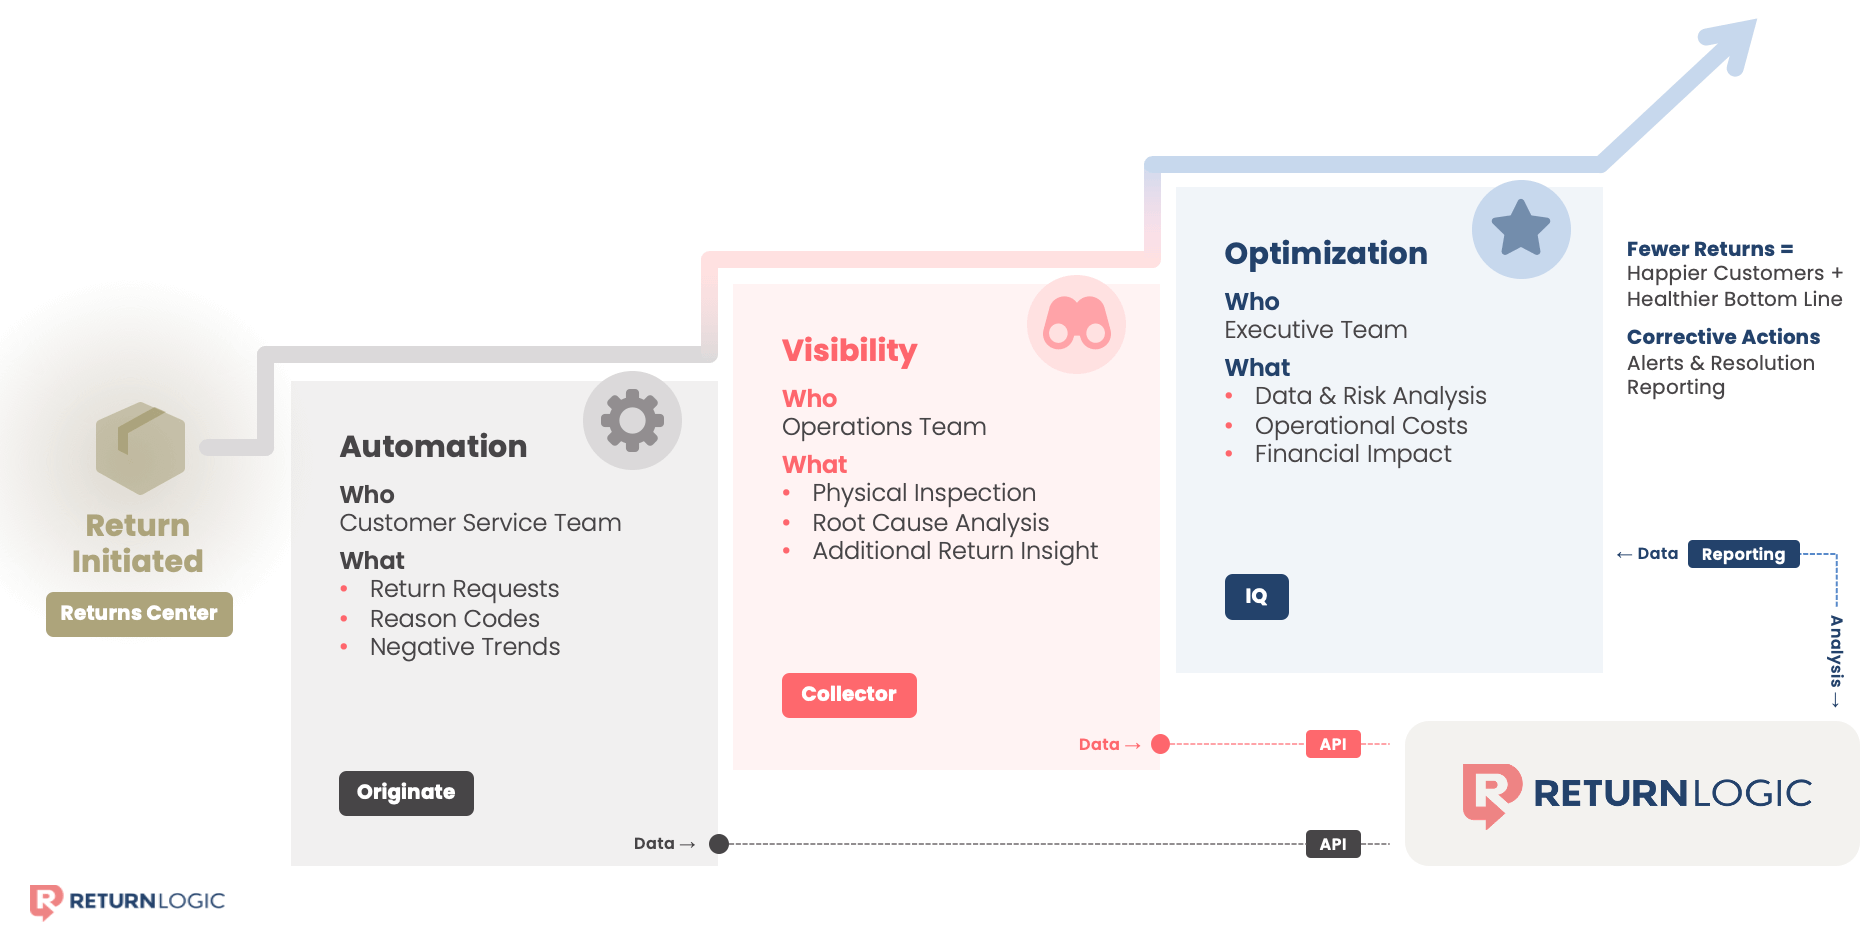
Image Source: ReturnLogic hierarchy of needs
The first step to creating a strategy for 2022 is to figure out where your company lies on the Returns Hierarchy of Needs. Doing this will make your focus for the year clear.
From there you’ll know to focus all efforts toward optimizing your returns management to satisfy the needs of where your company lands on the hierarchy.
Every retailer is on a returns journey, we hope some of these tips help you move up on the returns hierarchy of needs.
Wrapping up Returns in 2021
We’re learning more about returns every day. Whether it’s cost, how to turn returns into a revenue driver, what retailers want in their returns management platforms, or what to do with returns data, we’re here to share what we learn with you so that you can take action and finally feel like you’re ahead of returns, instead of playing catch-up.
If there’s one thing you should take away from all of this, it’s that returns can be your worst enemy or best friend.
If you try to resist, returns will bite you, but if you accept returns as a natural part of the customer journey, you can turn returns into your competitive advantage.
We hope these tips can help you in 2022 and we look forward to sharing all that 2022 teaches us about returns.
We hope you have a Happy New Year and good luck in 2022!