7 Reports to Streamline Your Ecommerce Operations Using Returns Data
Focus on Customer Experience in Ecommerce
The better we treat our customers, the better they will treat us. Industry giants such as Zappos, Amazon, and Dollar Shave Club are consistently recognized for their unwavering focus on the customer experience. This is no longer a nice to have, it is what customers have come to expect.
When you dig down the underlying component of their success is their creative use of data.
Each company harvests massive quantities of information regarding customers, purchase behaviors, and internal processes. And the end result is a well-mechanized commerce operation that ensures an outstanding experience for the customer, with the right balance of humanization and personalization to round it out. Returns data is a crucial element of this process that can help your business streamline ecommerce operations.
Operations and the Customer Experience
While we may never reverse engineer the sophisticated processes that support the big boys, we can utilize retailers’ orders and returns data to improve their operational efficiency on both sides of the customer journey.
To explore the operational efficiency of retailers, we will begin by looking at the time required to fill an order in the forward supply chain (fill time), and the time it takes to process a return in the reverse supply chain (RMA completion time).
Forward Supply Chain
Report #1: Average Order Fulfillment Time by Week
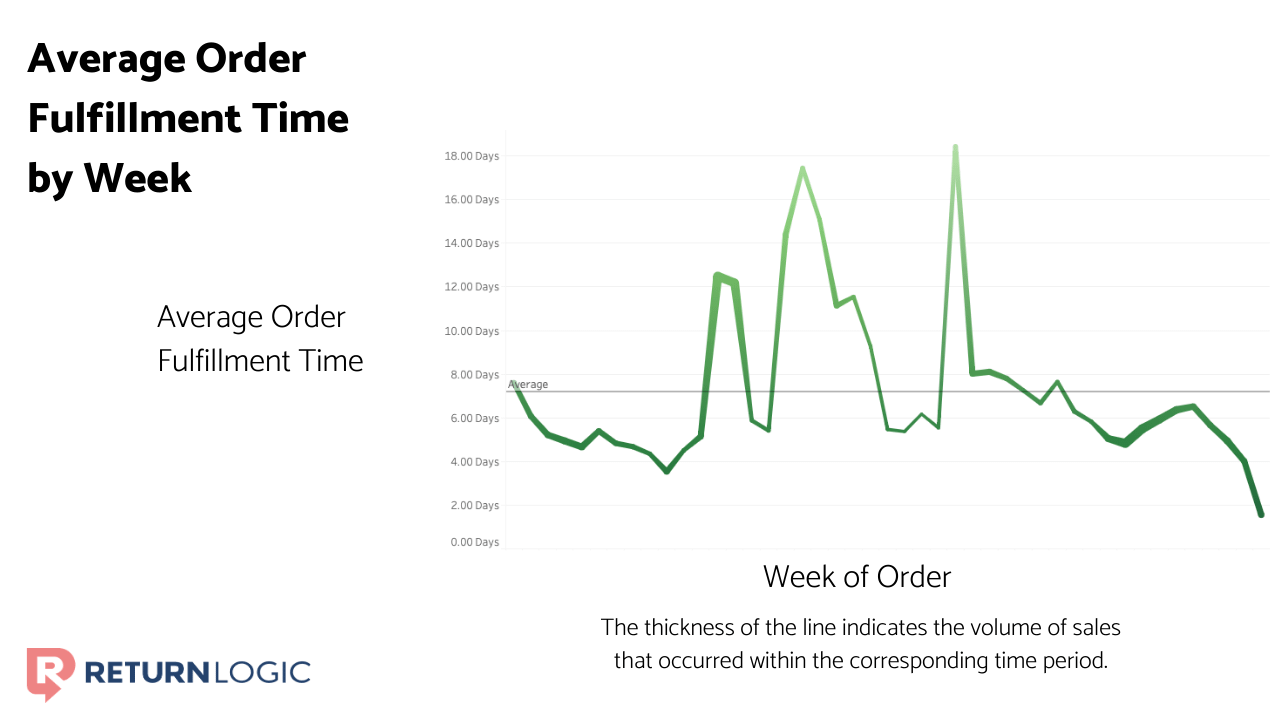
Above, we see the average order fill time for one of our retailers, who sells accessories for tech products.
It’s clear to see that the time to fill an order has varied dramatically over the course of the year. And while the peaks of fill time on occasion coincide with times of high sales volumes, this is not always the case.
This indicates opportunities to learn and improve in the internal process, to stabilize and reduce the time required to fill an order.
Report #2: Average Order to Ship Time by Day of the Week
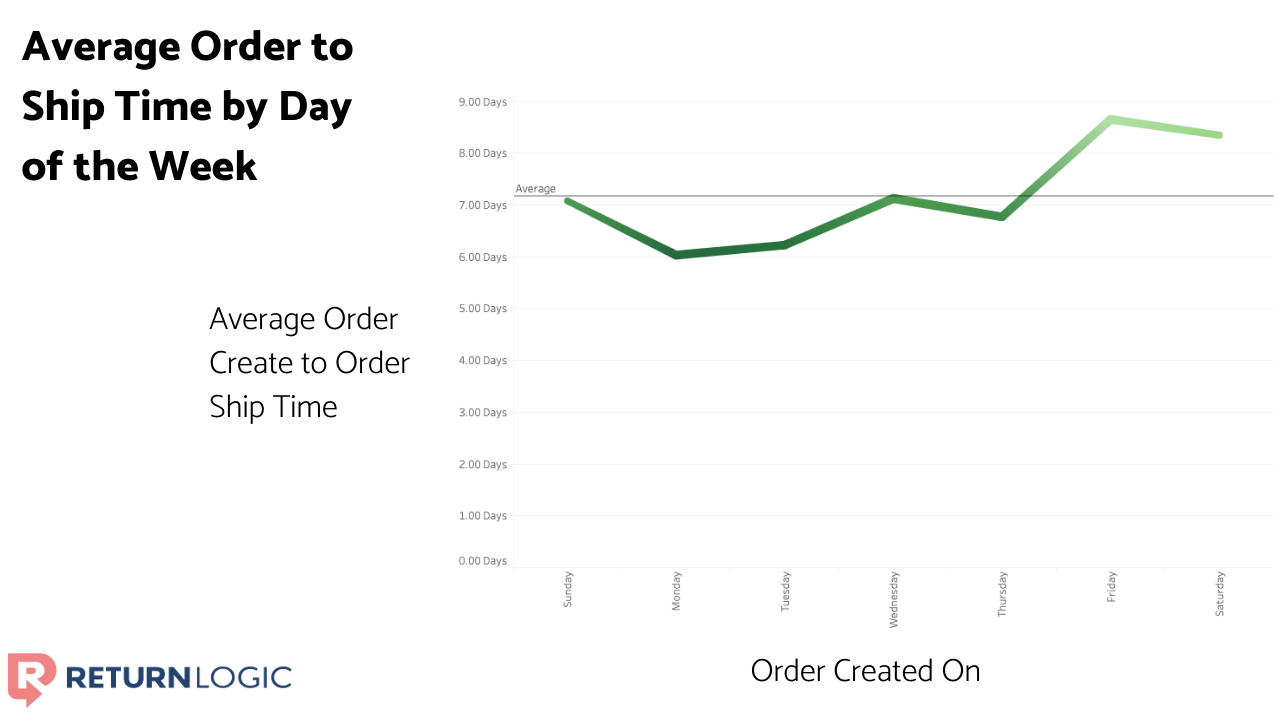
This graph shows the same time interval, but by the weekday that the order was created. We see that orders placed Monday tend to be filled the fastest, and somewhat intuitively, orders created on Friday tend to have the longest time until shipment.
Using this, we can pull levers such as staffing, resource prioritization, and even operating hours to further streamline ecommerce operations and ensure a smooth customer experience.
Reverse Supply Chain
Just as in the case of fulfillment in the forward supply chain, retailers can use data to improve operations in returns, the reverse supply chain.
Report #3: RMA Status Report
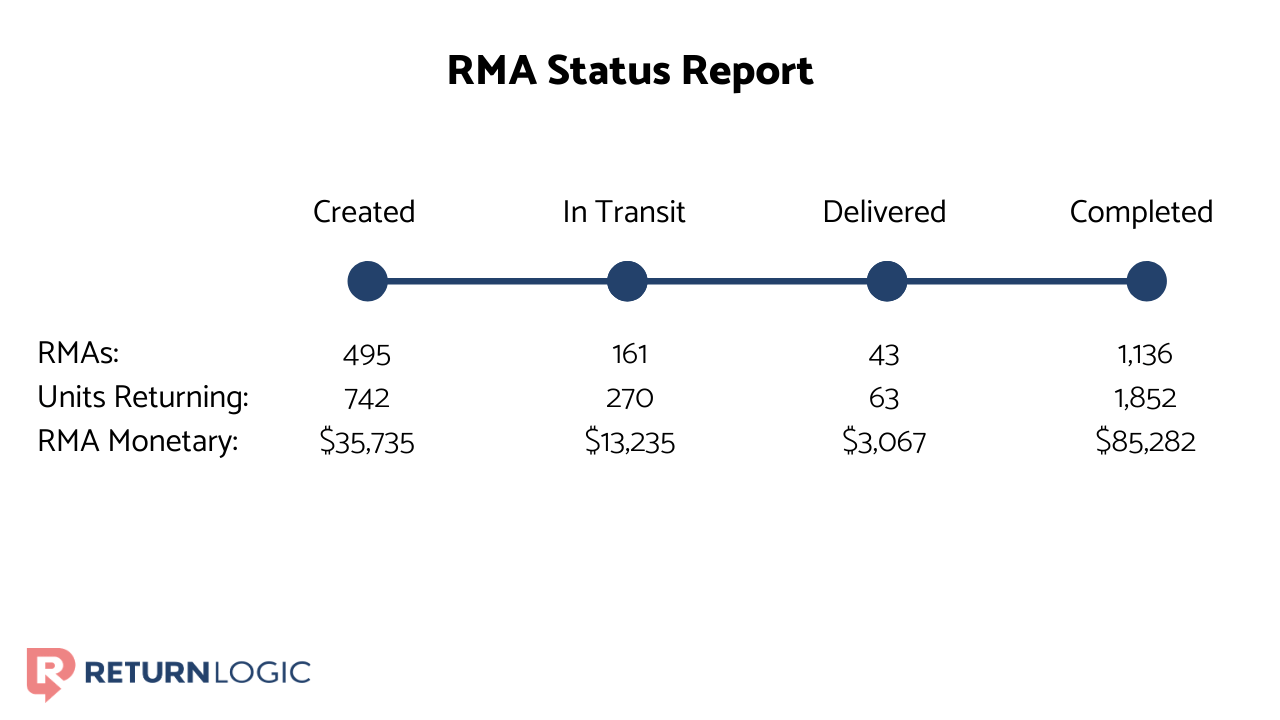
This report provides retailers with a snapshot of how many RMAs sit at each stage in the returns process. This report can provide visibility so bottlenecks can be identified and dealt with quickly.
Report #4: Average RMA Delivery to Complete by Week
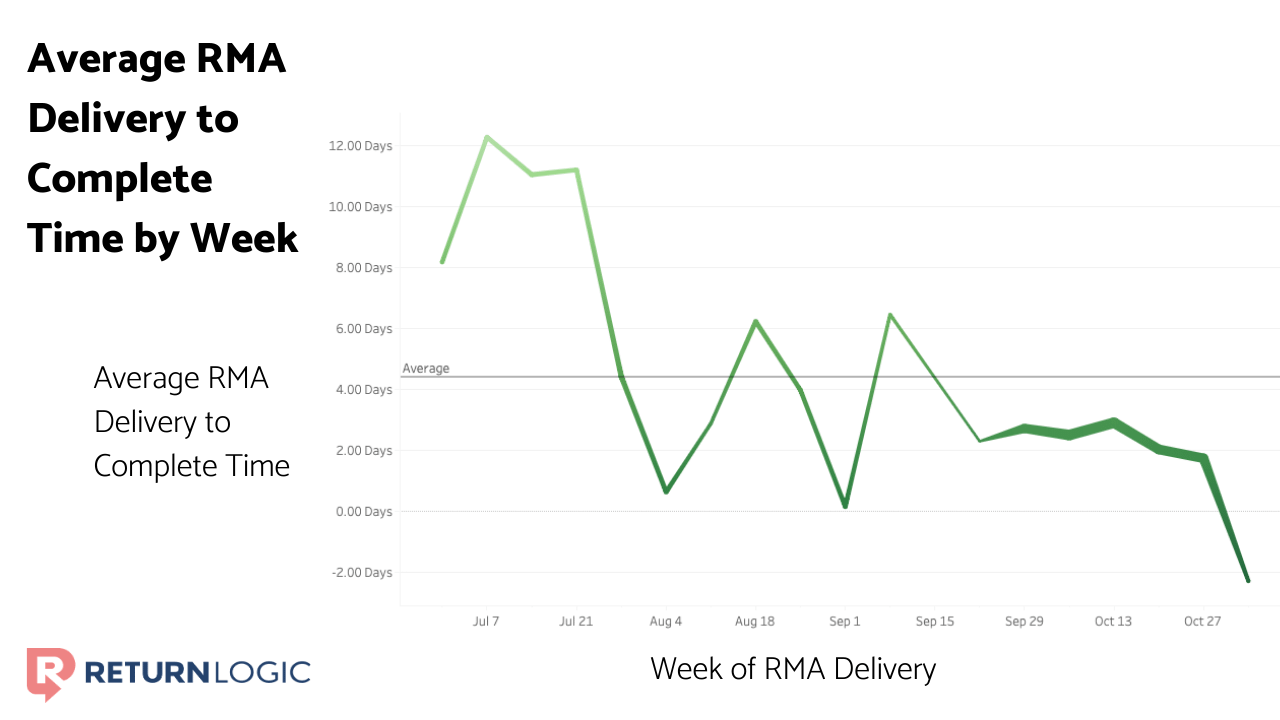
The above graphic illustrates the average time it takes to complete an RMA upon delivery at the warehouse, over time, for the same retailer. We observe that this interval has stabilized and decreased over the last several months, which is a positive sign from the prospective of operations and customer service.
The graph below conveys the same information, but in terms of the day of week an RMA was delivered at the warehouse.
Report #5: Average RMA Delivery to Complete Time by Day of the Week
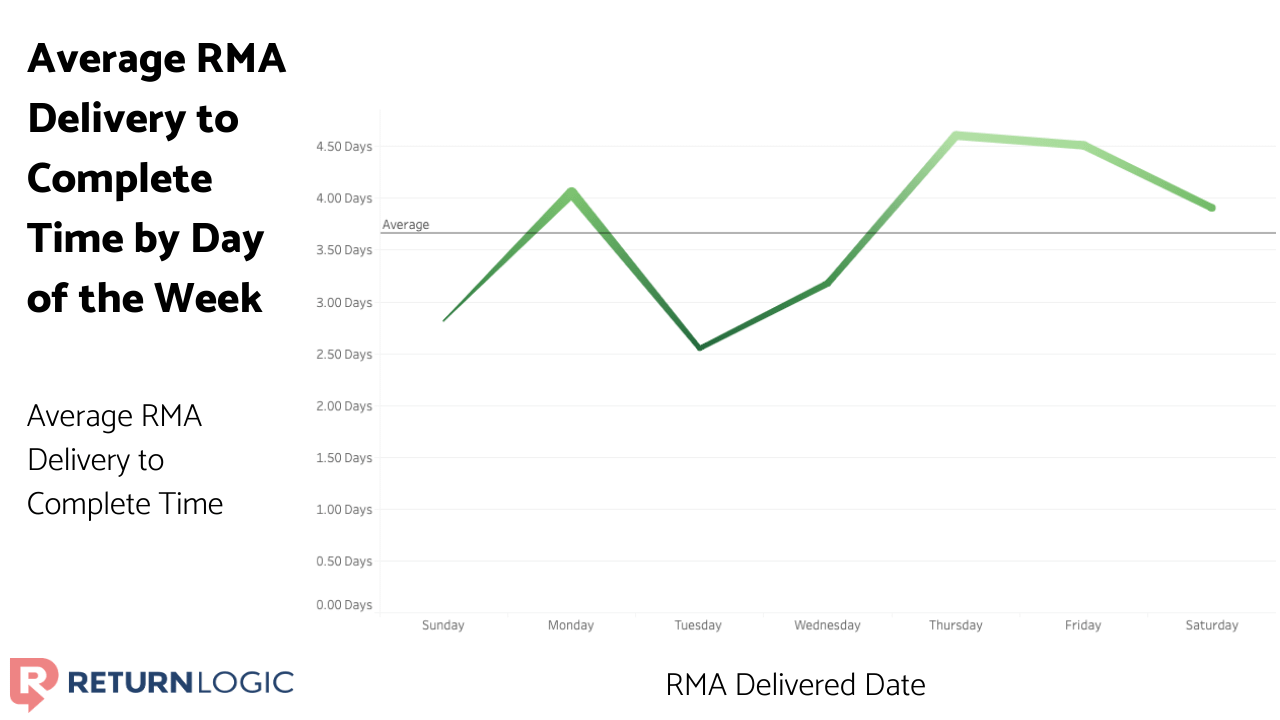
Similar to the case of order fill time, we see that the greatest intervals occur for RMAs that arrive at the end of the week. However, this graph shows us that RMAs delivered on Mondays also exhibit a relatively long time between the delivered and completed statuses, on average.
This is an interesting contrast to the short fill time for orders that were created on Mondays, and may indicate that the warehouse is bogged down by RMAs that have piled up since the previous Friday. In sum, this information could inform resource and personal allocation that can help your business streamline ecommerce operations.
Incoming RMAs
Many retailers we speak with want to know how many RMAs have been created or have reached transit in recent days.
This information allows them to better allocate resources to handle the units being returned, and to monitor the progress of individuals in the warehouse. ReturnLogic data can provide visibility into when an RMA is reaching each status in its journey.
Report #6: Total RMAs Marked “In Transit” by Day of the Week
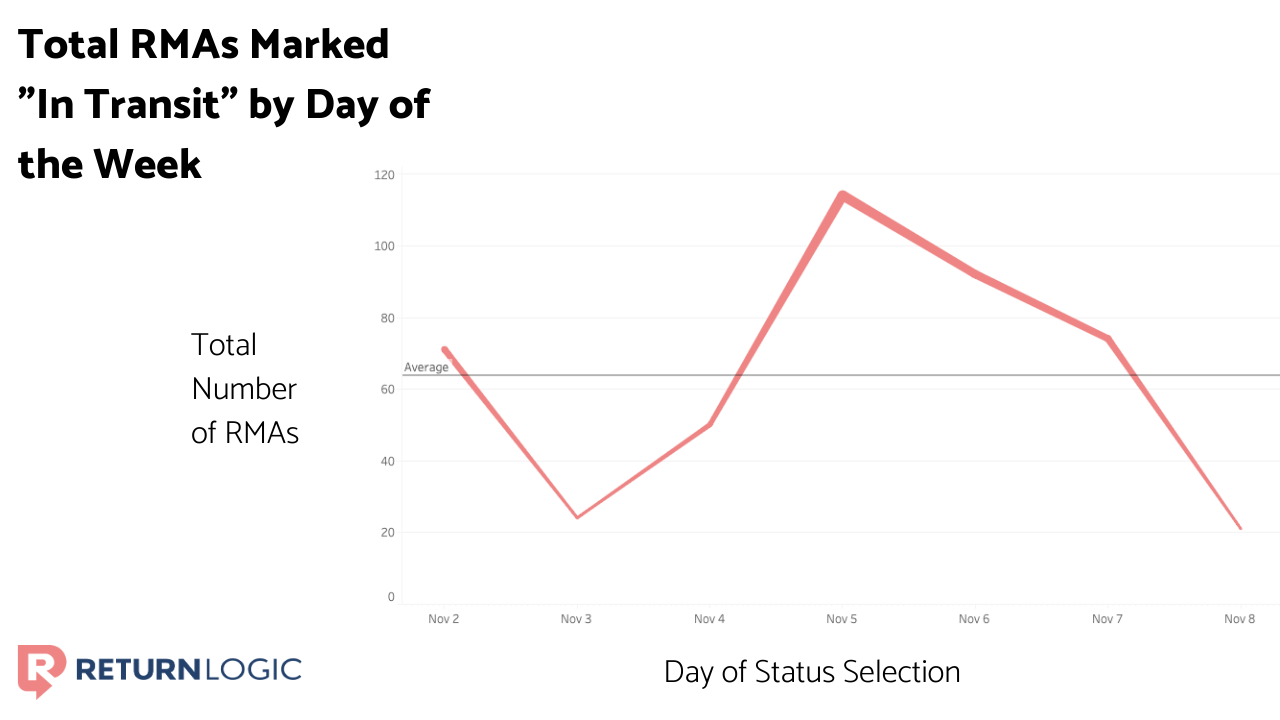
Here we see the number of RMAs that have reached transit status over the course of a week for another of our retailers. Using this breakdown, this retailer can better anticipate the quantity of returned products that will reach their warehouse each day, improving operational efficiencies and ultimately improving the experience for the consumer.
Cash is King: Understanding Your Return Liabilities
We’ll keep this portion short and sweet, since no one really needs to see the minutiae of retail accounting here. As with any business, ecommerce retailers have financial liabilities. And one that is an inescapable consequence of transactions is returns, specifically refunds.
Using recent sales information, we at ReturnLogic can estimate the value of sold products that are liable to be returned, and furthermore, likely to be returned. And using the retailer’s rate of refund, we can estimate the value that is likely to be refunded. That’s it – done with math.
Why would a retailer care about their pending refund liability? Because it is cash that is immediately susceptible to exit the organization. And for retailers with high sales volume, it may be no small figure.
Report #7: Return Liability Report
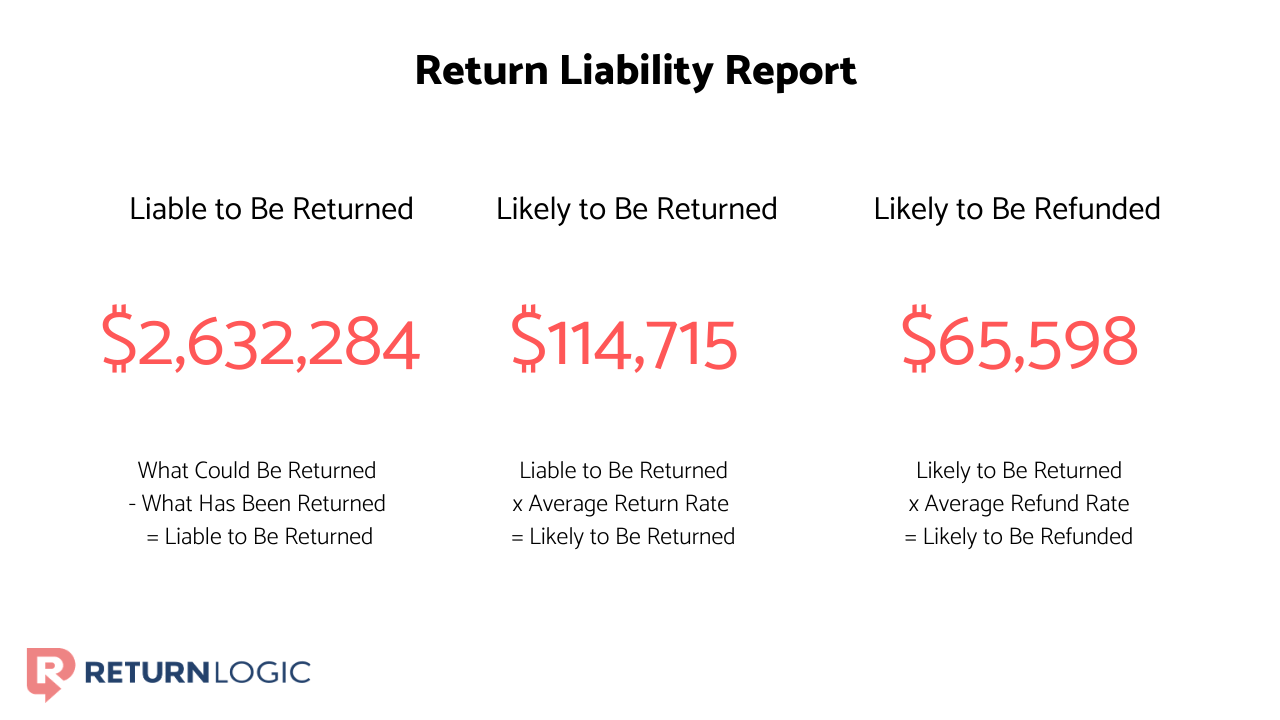
For one of our retailers, remarkably whose return rate is below 5%, the return liability hovers around $114,715. Since they also offer exchanges, this means that for this brand, they can expect to pay out about $66,000 worth of refunds for products they have already sold, and this will all occur within their return window (for this retailer 30 days) from today.
To Conclude
Though operations and customer service may be separate entities within a company, there is a remarkable amount of overlap in terms of their implications.
The faster an order can be filled, the sooner a return can be completed, and a refund issued, the happier the consumer will be. The more you Streamline ecommerce operations, the higher your customer lifetime value can be. Actionable data unlocks continual improvement for the most prolific commerce organizations and the same can be true for you.
You don’t need Amazon sized revenues to leverage data to improve your operations. Each improvement, however small, can contribute to getting the customer their product, exchange, or refund faster and thus contributing to the overall customer happiness.